
Last week finished up pretty uneventful with the U.S. equity market up less than a 1%. Even with a slow week we still saw some interesting action in momentum and Treasury’s. Let’s get into it…
Equity Trend
No surprise here, trend is still positive. We remain above the 20-day and 100-day moving averages as well as the trend line off the 2013 lows that’s help define the up trend for the last 12 months.
 Dow Theory
One interesting chart to note was the new high hit in the Dow Jones Transportation Average ($DJT) while the Industrial Average ($DIA) remains about 160 points away from its December high. in the bottom panel of the chart we have the relative performance between these two averages; and as the line falls we know that Transports have been leading the way for nearly the last year. We’ll see if the Industrials Average is able to follow its compadre higher.
 Equity Breadth
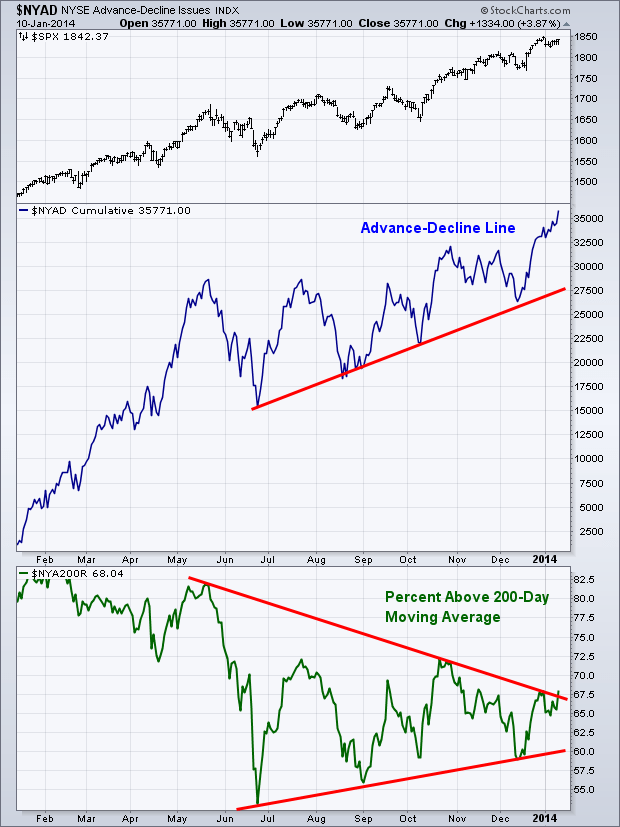
As the S&P 500 ($SPX) squeezed out a gain last week, we also saw some good movement in our two breadth indicators. The Advance-Decline Line continued higher and has now made a slight positive divergence as it hit a new high last week. The Percentage of Stocks Above Their 200-day Moving Average has just slightly broken out of its triangle pattern. The break was minimal and we will need to see a continuation higher this week, but things appear to be improving in the equity market internals.
 Equity Momentum
The Relative Strength Index continued to work off its ‘overbought’ status last week as it skirted around the 60 level. The MACD indicator continues to negatively diverge from price as it puts in a lower low.
 S&P 500 60-Minute
When we zoom in and look at the 60-minute chart of the S&P 500 ($SPX) we can see that price action has been trading in a tight range as it hugs the 50-1hr moving average. This type of action requires patience and I’ll be watching to see if we get a break to new highs above 1850 or if we put in a lower low under 1825. Both the RSI and MACD momentum indicators have flattened out and are not providing any robust clues in the direction the next move will be.
 Last Week’s Sector Performance
Health care ($XLV) was the leader last week in relative performance, up 2.25% more than the S&P 500. Next was the utilities sector ($XLU) which had a surprising bout of strength after being the laggard for the bulk of 2013. Energy ($XLE) was the worst relative performer followed by materials ($XLB).
 Year-to-Date Sector Performance
Since we have only had less than two weeks of trading I’m showing the long-term sector performance going back to the start of 2013. Once we get more price action under our belt I’ll begin discussing YTD performance figures. Like the weekly action previously mentioned, health care has been the leader over the last 12 months, followed by consumer discretionary (cyclicals). Utilities which was strong last week was not strong enough to bounce off the bottom and is still the weakest relative performing sector.
 10-Year Treasury Yield
I’ve showed this chart a couple of times over the last couple of months and the levels we have been watching are still holding up. It’s likely to no ones surprise that the 3% 10-year Treasury yield level has a fair amount of market supply that will need to be worked off in order for traders to take Treasury’s lower (and yield higher). With last week’s strength, largely following the weak Non-Farm Payroll report, we are now back under the falling trend line and still under resistance at 3%.
 Major Events This Week
We’ll be getting some measures of inflation this week which could stir up the bond market if we get a surprise out of the PPI or CPI reports. Traders will also likely be watching retail sales data that’s released on Tuesday to see how stores performed during the holiday season.
Monday: None
Tuesday: Retail Sales
Wednesday: Producer Price Index (PPI) and the Beige Book
Thursday: Consumer Price Index (CPI) and Jobless Claims
Friday: Housing Starts and Industrial Production
Don’t forget to vote daily for my blog for the TraderPlanet Star Award – Click here to vote!
Disclaimer: Do not construe anything written in this post or this blog in its entirety as a recommendation, research, or an offer to buy or sell any securities. Everything in this post is meant for educational and entertainment purposes only. I or my affiliates may hold positions in securities mentioned in the blog. Please see my Disclosure page for full disclaimer. Connect with Andrew on Google+, Twitter, and StockTwits.