I have the great honor to be one of two speakers at the upcoming CFA Society of Indianapolis Forecast Symposium later this month. The event will be taking place at the Gainbridge Fieldhouse in downtown Indianapolis, the home of the Indianapolis Pacers.
Ciff Asness of AQR will be the keynote speaker and I can’t wait to hear what he has to say as we move into the new year! I’ll be discussing my paper that won the Charles Dow Award, Forecasting a Volatility Tsunami as well as how I use technical analysis as a Portfolio Manager.
Disclaimer: Do not construe anything written in this post or this blog in its entirety as a recommendation, research, or an offer to buy or sell any securities. Everything in this post is meant for educational and entertainment purposes only. I or my affiliates may hold positions in securities mentioned in the blog. Please see my Disclosure page for full disclaimer.
2022 has been a very volatile year despite what the Volatility Index may show. This has caused many active investors and traders a great deal of frustration as they attempt to set their sights on a spike in the VIX to signal the “all clear” that the bear market has ended. This belief that the VIX must spike to mark a bottom has established as a criterion due to its common occurrence during most declines in stocks. However, like all market axioms, it’s not a requirement and market will do as it pleases to cause the most frustration possible! Charlie Bilello put out a great table showing that the S&P 500 has declined between 1% and 2% 29 times this year, the most since the Financial Crisis in 2008. The high number of daily swings that exceed 1% in both directions is a common characteristic of a bear market and is a development that we need to see end in order most likely to entice buyers to regain control of the tape in any meaningful fashion.
The spot VIX chart, shown below, hasn’t gotten above 40 during the current down trend – leaving many investors scratching their heads. Over the last decade readings in the 40s and even 50s were common markers of equity lows – or approaching low. The market this year has been more “orderly” but not without its fair share of daily volatility. The caveat being that daily volatility has come in both directions which is likely what’s helped keep a proverbial lid on the Volatility Index.
Below is a look at the number of days over the last 6-months we’ve seen the S&P 500 index advance or decline by 1+%. As of Weds., we’ve had 60 +/-1% days. This rolling figure peaked in July at 66, the most since the Covid Crash and before that, 2012 and 2009. Following the Financial Crisis we had over 90 days of +/-1% moves and in 2002 it peaked at 82 days. As we can see on the chart below, we’ve had an increase in daily volaltity, since it hasn’t occurred as a string of large down days – which would be like fuel for the VIX – the Volatility Index has not had a chance to experience a midlife crisis and instead has spent most of 2022 enjoying its 20s and 30s.
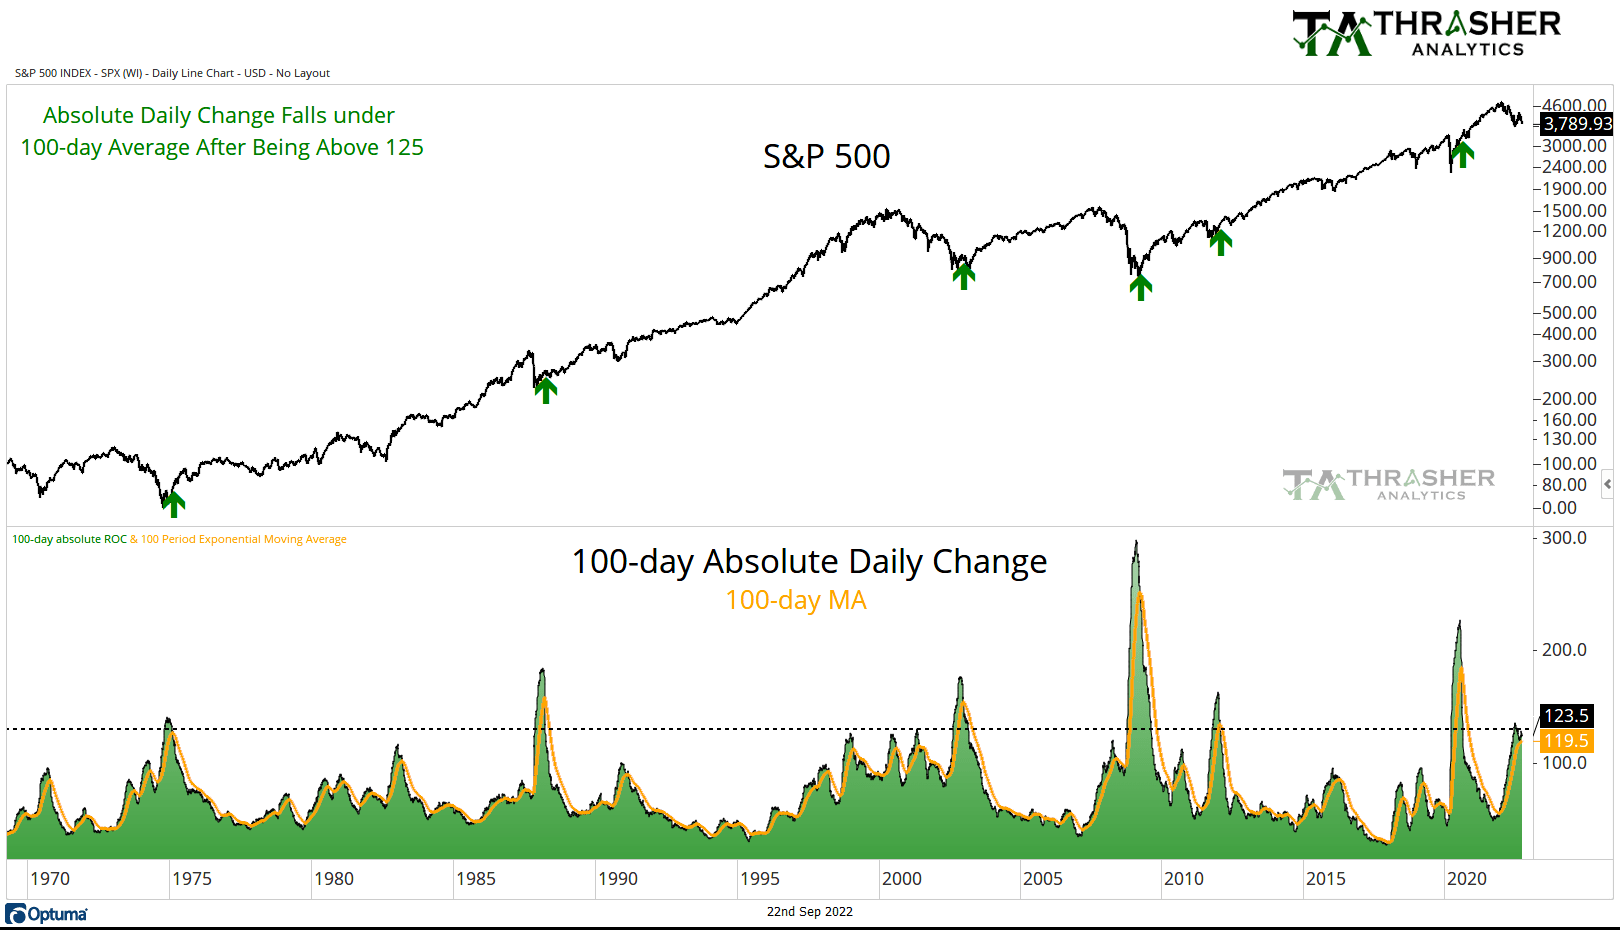
Rather than have tunnel vision on the absolute level of the spot VIX, I focus on the actual volaltity of the equity market as well. A concept that I believe was popularized by Ned Davis Research involves monitoring the 100-day cumulative absolute daily change as a gauge of market volatility. This is plotted on the chart below, along with the 100-day average of this data set. Since the 1970s, a common marker of markets shifting from bear to bull market has been a calming of daily activity. Market declines during this 50 year period all saw the cumulative total of daily change fall from a high of over 125 to under the intermediate average.
Historically, we haven’t seen a decline the size we’re experiencing today end without an end also to large daily moves. Fewer daily swings allow investors to wade back into the waters, no longer fearful of being smashed by a wave of volaltity. Currently, we’ve seen the cumulative 100-day total peak above 125 but it’s yet to cross under the intermediate average. We’re close! …But not there yet. I’ll be watching, and sharing in my weekly Thrasher Analytics letter, how this chart develops and when we begin seeing calmer waters develop.
Disclaimer: Do not construe anything written in this post or this blog in its entirety as a recommendation, research, or an offer to buy or sell any securities. Everything in this post is meant for educational and entertainment purposes only. I or my affiliates may hold positions in securities mentioned in the blog. Please see my Disclosure page for full disclaimer.
When we talk about “energy” we often are referring to both the sector and the commodities as they often move together in the same direction. When oil and natural gas are rallying, the stocks of the companies that are involved in their sale and exploration often are going higher as well, and vice versa. However, there are times where the correlation breaks, which we’re seeing right now with energy stocks showing strong recent performance as oil prices struggle.
Energy Sector Performance As for energy stocks, they’ve been the strongest corner of the equity market. Here’s the YTD and 1-year performance of the S&P sectors.
Stocks vs. Commodity Below is a look at the Energy Sector (XLE) and Crude Oil. Both saw strong up trends at the start of the year and after a stumble in June, energy stocks have resumed going higher. In fact, XLE is the best performing sector by a long shot, up nearly 40% YTD. But look at Oil. It’s continued to move lower.
Energy stocks aren’t the only area of the financial market we’re seeing up trend against a weakening commodity.
Below we have the Crack Spread, the spread between the price of a barrel of crude and the price of produced refined from oil. Typically, the Crack Spread moves with the price of oil. Similar to energy stocks, the Crack Spread peaked in June but did not make a lower-low, instead it tested its prior low and bounced higher (blue arrows) and is close to rallying back to its prior high.
Here’s the same chart as above but with a historical study shown in green of when the Crack Spread was in the upper 80th percentile of its historical range while oil was in the bottom 40th percentile. Since 2010, when the Spread was showing strength relative to crude, the price of oil often played “catch up.” November ’14 was the exception, as crude continued to decline
Looking For The “Why” What’s likely the likely cause of the break in correlation? In August, Bloomberg ran an interview with the Saudi Energy Minister, who cited the dislocation paper and physical markets. Suggesting the need for OPEC to cut production to bring the two markets more inline.
Saudi Arabian Energy Minister Prince Abdulaziz bin Salman said “extreme” volatility and lack of liquidity mean the futures market is increasingly disconnected from fundamentals and OPEC+ may be forced to cut production.
“The paper and physical markets have become increasingly more disconnected,” he said in response to written questions from Bloomberg News.
Energy Sector Valuation Has the strength in energy stocks caused the sector to become ‘overvalued’ (if you’re into that kind of analysis)? Based on the work by JPM, no. Instead, JPM shows the spread in the energy sector’s forward P/E vs. the broad market has never been lower in thirty years.
European & American Energy Crisis Meanwhile, the crisis in Europe continues to intensify and is only being made worse (in my opinion) by the government attempts to treat the symptoms instead of the cause of the pain. Most recently, the inflation rescue package which will simply increase demand and put more pressure on prices to rise. Household energy costs in Germany are up 43% YoY. Gameshows in the UK are now a “Wheal-of-Fortune” type game to pay off viewers electric bills. It’s not just household energy costs that are squeezing Europeans. Farmers in Europe are facing natural gas bills that have gone from are up 17x. In Italy, consumers are publicly burning their energy bills in protest of rising prices.
Americans are also feeling the squeeze with 1 in 6, which equates to 20 million homes, falling behind on their utility bills according to the NEADA. The chart below from Bloomberg shows the average American has seen a 15% rise in prices from last year. In California, consumers have experienced a 40% rise since Feb. 2020.
All of this has occurred before Russia turned off Nord Stream 1 and stopped the flow of natural gas to Europe. Klaus Meuler, the president of the Fed’l Network Agency said that while gas storage is 95% full, Europe is still just 2.5 months of demand. What’s the worst case scenario? That the rise in energy prices becomes Europe’s “Lehman moment” and begins a domino effect of companies going under. In July we saw Germany bail out Uniper with a 15 billion euro ($15.2 billion) rescue package. Several European countries are now discussing or have already implemented price caps on utilities. In the U.S., the government continues to empty its reserves with the SPR falling to the lowest level since 1984.
What’s the bearish argument for oil? Demand destruction. We’re not likely to see the energy crisis be resolved from the supply side outside of some massive coordinated effort by OPEC and/or Russia leaves Ukraine and their flows to Europe return to normal. Instead, prices could continue lower if demand dries up which would likely be associated with an economic slowdown that puts pressure on not just commodity prices but all financial markets. And even then, the drop in demand would need to outstrip the crisis on the supply-side.
What’s Next From here, I think we could still a rise in energy markets and the respective energy commodities. European governments will continue to put band-aids on the crisis that throw more fuel on the fire than extinguish it. However, I’m a technician first and will allow price action to dictate my bias. I think the divergences in the Crack Spread and Energy Sector are bullish for oil, natural gas, and gasoline.
Disclaimer: Do not construe anything written in this post or this blog in its entirety as a recommendation, research, or an offer to buy or sell any securities. Everything in this post is meant for educational and entertainment purposes only. I or my affiliates may hold positions in securities mentioned in the blog. Please see my Disclosure page for full disclaimer.
Much as been written and discussed by traders since June following the start of the bear market that plagued global equities in the first half of 2022. Each up tick gets analyzed to death and questioned, “was that THE bottom?” is what market pundits keep asking and traders keep attempting to answer. In my own Thrasher Analytics letter, I’ve been discussing price levels I’m watching and key indicators and markets that may give a clue through leadership or confirmation if we’re shifting out of a bear market and into a new up trend or if we’re just in the throes of a bear market rally.
One such tool available to technicians is reviewing the amount of the prior decline the bounce has retraced or ‘made back.’ What we’ll discuss today is the 50% retracement level. I’m not one to often use Fibonacci sequences or retracements but many traders I highly respect do. Many would argue that 50% is not actually a Fibonacci number even though it’s often shown in many charting software packages. My focus has less to do with rabbit reproduction (the original purpose of Fibonacci numbers) and more on the market psychology of recovering half of a market decline.
Last week Carl Quintanilla shared a chart by Jonathan Krinsky, CMT, Chief Market Technician at BTIG, noting the importance of the 50% retracement how bear market rallies don’t exceed these levels in the middle of drawdowns.
Looking at market history for both the S&P 500 and the Dow Jones Industrial Average (which has a longer history of data available to me, back to 1900) I reviewed each time the closing price came within half a percent of retracing 50% of the prior decline after the drawdown has exceeded -20%. I chose half a percent as to allow a little ‘wiggle room’ for price to come a few points above or not quite reach the threshold of 50% and still be included in the study. It’s the general theme we’re here for after all.
Let’s start with the Dow
Here we can see every major decline in the last 122 years. Blue arrows indicate when price came with 0.5% of retracing 50% after a ‘bear market’ had begun.
And here’s the S&P 500
You’ll notice that one of two things occurred each time. 1. Price continued to advance higher, as it did in April 2019, June 2009, and June 2003 (noting a little theme with June). 2. Or the rally ran out of steam and sellers took back control of the tape, like in May 2001 and March 1930.
Thankfully, the sample size is small, meaning we haven’t seen many large drawdowns to review and many of them reached the 50% retracement level and continued to move higher. This is not to suggest that the 50% recovery level is the ‘end all be all’ to closing the door to market down turn. The market can always throw a curveball, but our ability to review market history gives us insight into how price has responded at such a level. It seems that traders become more confidence in the durability of the low after it’s able to recover half of what had been lost.
Where’s that leave us today? Here’s the S&P 500 chart again but zoomed into to the last 22 years. The 0.5% range around the current 50% threshold is 4252-4209. This is just above the heavily watched 4200 level that was roughly defined by the March swing low and June swing high earlier this year. As of Friday’s close, we’re about 2.5% from the S&P being in that range so if buyers remain in control, it’s very possible we see how price responds in the next week or two should the index push higher.
Thrasher Analytics LLC is not registered as a securities broker-dealer or an investment adviser either with the U.S. Securities and Exchange Commission (the “SEC”) or with any state securities regulatory authority. Rather, Thrasher Analytics LLC relies upon the “publisher’s exclusion” from the definition of “investment adviser” as provided under Section 202(a)(11) of the Investment Advisers Act of 1940 and corresponding state securities laws. The information contained in our reports, newsletters, or other produced content should be viewed as commercial advertisement and is not intended to be investment advice. The report is not provided to any particular individual with a view toward their individual circumstances. The information contained in our report is not an offer to buy or sell securities.
Disclaimer: Do not construe anything written in this post or this blog in its entirety as a recommendation, research, or an offer to buy or sell any securities. Everything in this post is meant for educational and entertainment purposes only. I or my affiliates may hold positions in securities mentioned in the blog. Please see my Disclosure page for full disclaimer.
One of the charts I sent to Thrasher Analytics subscribers on Sunday looked at the large increase in stocks that were trading below average volume on Friday. Since the end of last year, this has been a bearish development for markets, a sign that buying has become exhausted and counter-trend rallies ended. However, this isn’t always the case. In fact, in strong bull markets we see the market give a completely different response to these low volume spikes. Because of that, we can use this type of data to assist in identifying the type of market we are in. Let’s look at some examples.
Each chart I’ll share below will have the same types of data but look at different periods of time. On top will be the S&P 500, in the middle will be the percent of S&P 500 stocks that traded each day with below-average volume, and in the bottom panel (in red) is the same data but only shows the days that the market closed above the open and there were more than 50% of stocks trading on below-average volume (this allows us to more clearly see the instances of days with lots of low volume).
1996 to 2004 First, let’s go back to the DotCom boom and bust. From 1996 until the peak in 2002 we had several occurrences of over 50% of stocks trading on low volume, and what did the market do? For the most part, ignored it. Bulls were in charge and demand was so strong that it didn’t matter if volume was low or not. Then things began to change in 2000. The market began to go sideways with these days of most stocks trading on low volume. This became a sign that potentially buyers were becoming exhausted. Then the trend changed, and the Index began to go down through 2003. Each counter-trend rally was ended when stock volume dried up. After the market bottomed and an eventual new up trend began to form, the market went back to ignoring these low volume days once again.
2007 to 2010 Now we have the Financial Crisis. Going into the eventual 2007 peak we can see, once again, the market moving higher despite a pick up in stocks trading on low volume. But once we went into a bear market down trend, those days mattered – putting an end to each counter-trend advance. But look at the far right of the chart in late 2009, volume was low, due to Thanksgiving and Christmas, but we still saw markets rally higher, the regime had shifted.
2012 to 2015 One of the strongest years over the last decade was in 2013. Look how in 2012 and 2013 the market moved higher even with most stocks seeing days of below-average volume. Again, the bulls were in charge and demand stayed strong. Then in 2014 we saw the major averages consolidate. The below-average volume began to matter again as bulls didn’t carry the same control as they had in prior years.
2021 to Current Now we have the last 18 months. Bulls had full control of equity markets in 2021. Even though there were days most stocks traded on little volume, buyers ran the show. Then notice in mid-August we had 58% of large cap stocks trade on below-average volume and the index didn’t rally but went sideways-to-down. Looking back, that was a sign that the regime may have begun to shift out of the bulls control. Then we kicked off the new year and in 2022 markets have moved lower. Each time bulls made an attempt to regain control with a count-trend rally, it resulted in a lack of buyers and a lack of volume which put an end to each bounce. On Friday about 62% of stocks traded on low volume and as trading started this week, the S&P 500 fell 1% on Monday – suggesting this theme and the bearish regime is still ‘in play.’
These days it seems volume is often dismissed. Traders argue that high frequency trading has mucked up the data, making it no longer a useful tool. I strongly disagree. However, I will note that we can’t view volume data blindly. Drops in volume around holidays or days with shortened market hours are important to recognize when doing analysis.
The above examples show how we can still evaluate the health of the market based on if individual stocks are trading on low, high, or average volume. With this data in hand we can begin making conclusions if the market is in a bearish or bullish regime and evaluate how the market ‘reacts’ to these changes in volume as signs of those regimes changing.
Thrasher Analytics LLC is not registered as a securities broker-dealer or an investment adviser either with the U.S. Securities and Exchange Commission (the “SEC”) or with any state securities regulatory authority. Rather, Thrasher Analytics LLC relies upon the “publisher’s exclusion” from the definition of “investment adviser” as provided under Section 202(a)(11) of the Investment Advisers Act of 1940 and corresponding state securities laws. The information contained in our reports, newsletters, or other produced content should be viewed as commercial advertisement and is not intended to be investment advice. The report is not provided to any particular individual with a view toward their individual circumstances. The information contained in our report is not an offer to buy or sell securities.
Disclaimer: Do not construe anything written in this post or this blog in its entirety as a recommendation, research, or an offer to buy or sell any securities. Everything in this post is meant for educational and entertainment purposes only. I or my affiliates may hold positions in securities mentioned in the blog. Please see my Disclosure page for full disclaimer.