A Breakdown In Copper

Before we get into discussing copper, I want to talk a bit about yesterday’s price action in equities….

We saw the big momentum names see some weakness, as well as small caps while the S&P ($SPX ) held on and closed pretty much flat. But what’s interesting is when we look under the hood we can see some internal damage that flipped some of the mean-reversion metrics to be short-term bullish. I bring this up because we can’t assume that since the market closed flat that nothing else changed. We are seeing some of the reaction to this today with, at the time of this writing, the e-minis ($ES_F) up over a 1%. Yesterday’s low also happened to be at the 50% Fibonacci Retracement level off the August low. So while equities were flat, we still got a great deal amount of information from the market internals.

Okay, back to copper.

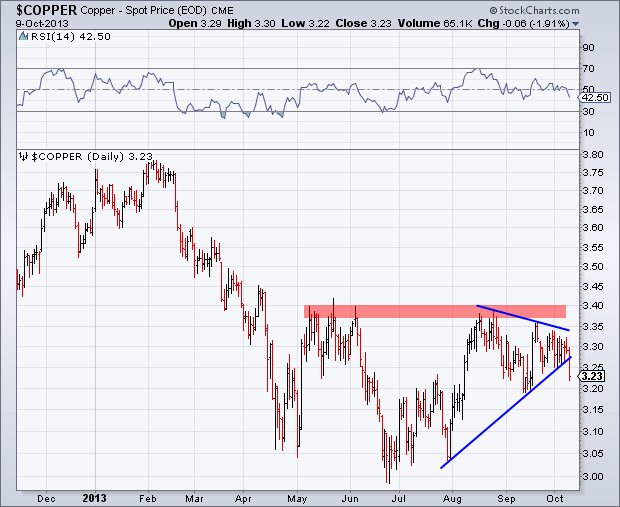
While all the action seems to be happening in the equity market, copper ($HG_F) has been consolidating as it creates a triangle pattern. This has occurred just under the resistances that’s stopped copper’s attempts at advance in May and August. I last talked about this level in late-August when  I wrote about this resistance that copper hit and was unable to break though.

Yesterday we had a break of support as price heads lower and approaches the previous low of $3.20. During periods of consolidation like copper has been it, we typically see continuation of the longer-term trend – which in this case would be down. We’ll see if copper bears take us to the June low near $3.00 and if it is able to hold up as support. On the upside we could see the previous support trend line that has just been broken become resistance. It appears we are getting some confirmation in the break today, as copper heads lower. I’ll be watching to see where this one ends up at the close.


copper

Disclaimer: Do not construe anything written in this post or this blog in its entirety as a recommendation, research, or an offer to buy or sell any securities. Everything in this post is meant for educational and entertainment purposes only. I or my affiliates may hold positions in securities mentioned in the blog. Please see my Disclosure page for full disclaimer. Connect with Andrew on Google+, Twitter, and StockTwits.

New Short-Term High Could Take Us Either Way

I’ve spent most of the evening thinking about this tape. With today’s close we are back to the early July high, which means it’s time to open the hood and look at the engine to determine if what’s driving this market is sustainable or not.

What is so frustrating is there doesn’t seem to be a clear signal from what I’m seeing. I could go either way. On one hand we have the Aussie dollar, which mirrored the move we saw in the S&P 500.

We also have the S&P breaking above a falling trendline (blue) and it still has room to run until it hits the rising trendline (orange) around 1390-1400.

We also have the fewest number of bulls based on AAII Sentiment data since August ’10, which has historically been a fairly good bullish contrarian indicator.

While on the other hand neither copper (JJC), China (FXI), the financials (XLF), or Technology (XLK) participating in hitting their early July highs. These four are typically leading indicators of price movement in the major indices. When we don’t see cooperation in any of them, a warning sign goes up.

Also, if you look at the S&P 500 chart posted above, in the bottom panel we see the On Balance Volume indicator which I’ve talked about numerous times. OBV simply adds the number of shares traded on positive days and subtracts the number of shares traded on negative days to give an idea of whether buyers or sellers are controlling the tape. During the recent rally we have not seen buyers step up in force while the S&P got back over 1370.

Finally, small caps (IWM) were also not present on the list of those hitting their short-term high. Typically, I like to see large caps be accompanied by the small caps during critical market junctures as a sign of traders adding beta to their portfolios. We saw a similar divergence where small caps were nowhere to be found when the S&P hit a new high back in April, with IWM putting in a lower high.

So now you can understand my frustration. We have cooperation from some and a lack there of from others. Although it will take more market action to play out before we may know if this rally can continue or if the intermediate downtrend is still intact, it seems there may be a slight bias to the upside for the time being.

 
Disclaimer: Do not construe anything written in this post or this blog in its entirety as a recommendation, research, or an offer to buy or sell any securities. Everything in this post is meant for educational and entertainment purposes only. I or my affiliates may hold positions in securities mentioned in the blog. Please see my Disclosure page for full disclaimer. Connect with Andrew on Google+.