
Another week, another new high in U.S. equities. It appears traders are not concerned at all with the low level of volatility or the bearish summer seasonality. Which is a great example of why confirmation is so critical when it comes to technical analysis. One interesting point to make about Thursday’s close is that the S&P 500 closed out last week above both its daily and weekly upper Bollinger Band. Next week we get an important cycle peak, which will be occurring while a much larger cycle that I’ve written about before, begins to peak as well. While it appears the market internals remain bullish, I’ll be watching to see if any other price-related data begins to show signs of bearish to support these peaks in
Equity Trend
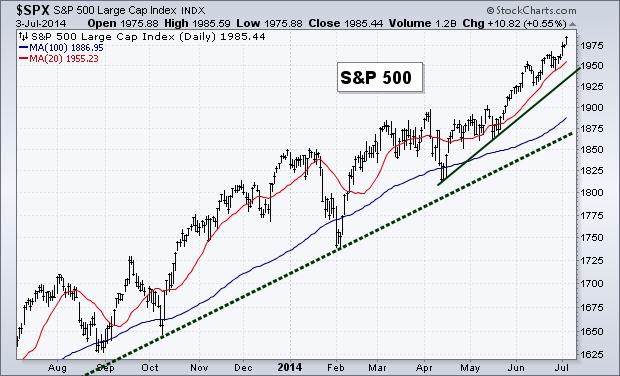
With another new high, the trend in the U.S. equity market is of course still positive.
Equity Breadth
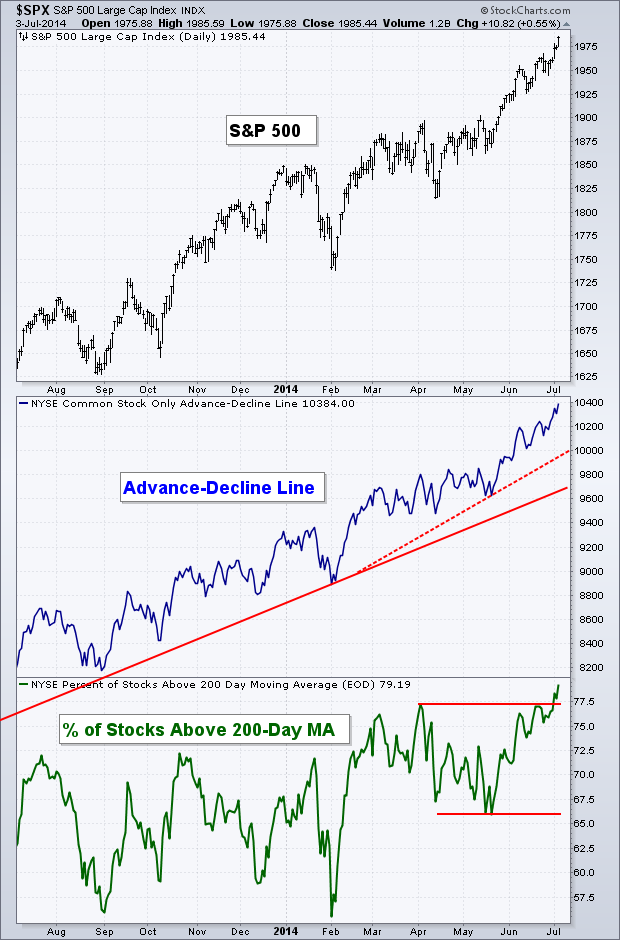
As stocks rose last week, so did both our measures of market breadth. The Advance-Decline Line hit a new high last week, which has continued to confirm the bullish advance in equities. The Percentage of Stocks Above Their 200-Day Moving Average also broke out above the resistance I had been noting, hitting the highest level since May, 2013.
Commodities
The agriculture space has just gotten destroyed recently. I came into the year one of the few commodity bulls. On April 14th I wrote about the bearish chart of Coffee ($KC_F) which had been of the strongest commodities in the first four months of 2014. Coffee’s weakness ended up assisting in the drop for the whole ag sector. But right now it looks like there may be some bullish signs coming back to the PowerShares Multi-Sector Agriculture ETF ($DBA).
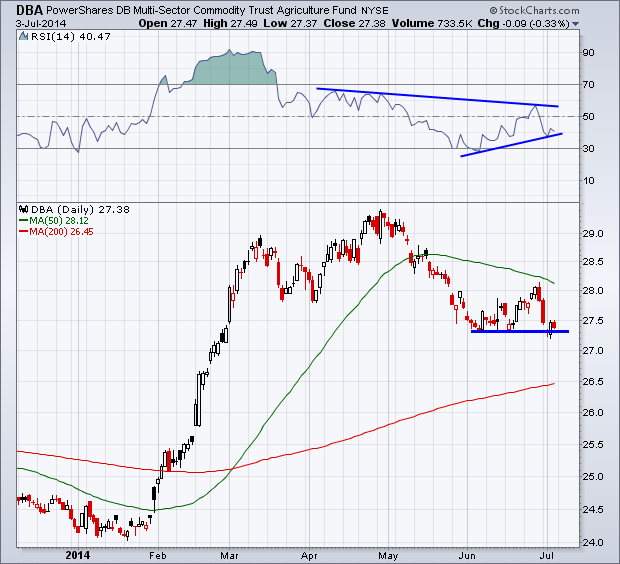
Below is a daily chart of $DBA along with the Relative Strength Index (RSI) in the top panel. While the commodity ETF has been falling from its peak in Late-April, it appears we may be starting to see signs of a double bottom in price. As $DBA re-tests $37.30 we can see that the RSI momentum indicator has created a positive divergence. On the initial test of this price level the Relative Strength Index broke under 30, but has been rising and setting higher lows while price continued to retreat. The momentum indicator rose up to the trend line resistance from the prior high in April, and this trend line (and the June high) will act as a good place for momentum to break if things begin to improve.
It’s important to note that the 50-day Moving Average has begun to fall, which isn’t a great sign and will likely act as some form of resistance if price does indeed rise. On the downside we have the 200-day MA about $1 under the current price level.
 Silver
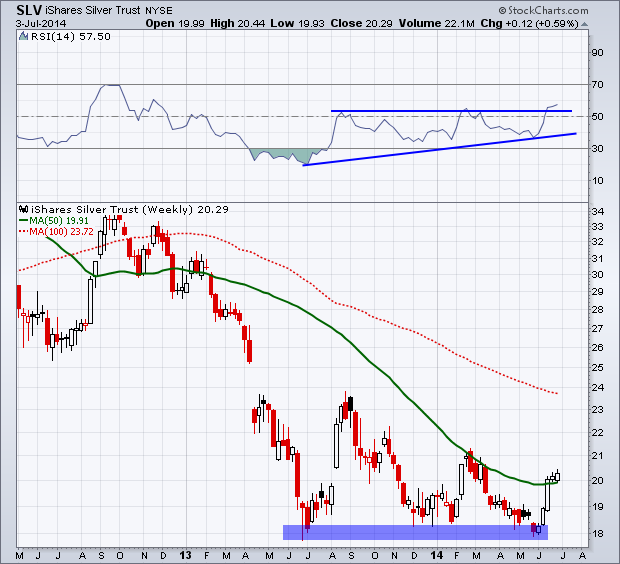
While on the topic of commodities I wanted to show an updated chart of Silver ($ZC_F). On June 13th I wrote a post called Three Bullish Charts for Silver. In the prior post I mentioned that I would be watching to see if Silver could get back above its 50-week Moving Average as well as the resistance that had taken place around 50 in the Relative Strength Index. After a few weeks, we now have both levels of resistance (in price and momentum) broken. Now if Silver can continue to climb and get above the previous 2014 high then we’ll have the down trend broken as price makes a higher high.
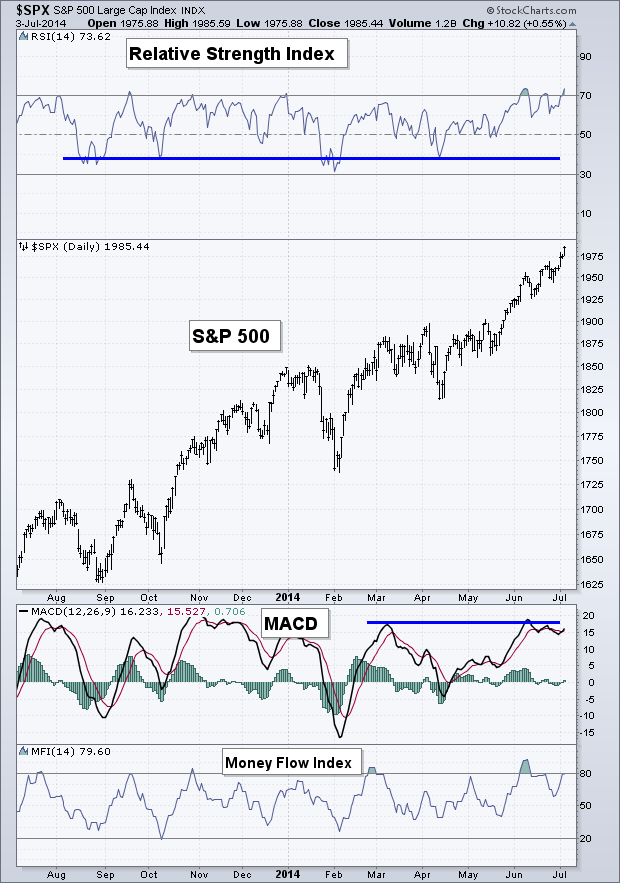
Equity Momentum
Once again we closed out trading for the week with the RSI indicator in ‘overbought’ territory as bulls continue to maintain control. As I’ve discussed numerous times, while momentum being ‘overbought’ is short-term bearish it is in fact long-term bullish as a sign that healthy buying is still present within the market. The MACD indicator in the bottom panel of the chart has continued to flirt with resistance. While a break of this trend line would be bullish, the MACD has yet to make any serious lower lows, keeping this indicator in a ‘neutral’ stance.
 Fat Tail Risk
The Skew Index, which is a measure created by the CBOE to help traders measure ‘fat tail risk’ (if you believe that’s truly something you can measure). Here’s how the CBOE describes it: “The CBOE SKEW Index (“SKEW”) is an index derived from the price of S&P 500 tail risk. Similar to VIX®, the price of S&P 500 tail risk is calculated from the prices of S&P 500 out-of-the-money options.”
The Skew Index has been rising recently and so I suppose it’s worth a mention. Currently the Index that’s meant to predict an ‘outlier’ move in the S&P 500, is now at its third highest level. We saw the Skew Index rise at the end of last year and we would have to go back to 1998 to find a time when Skew was higher than that. What does it mean? Some would interpret this as a sign that traders are beginning to price in a large move based on options activity. You can make your own assessment of its validity.

60-Minute S&P 500
While the daily chart is still in an up trend, so is the short-term intraday trend. We continue see a series of higher highs and higher lows on the 1-hr chart of the S&P 500 ($SPX). The RSI index finished trading on Thursday above 70 and the MACD continues to digest the level of resistance plaguing the short-term trend since early June.

Last Week’s Sector Performance
While last week saw just 4 days of trading, it wasn’t a great week for the Utilities sector ($XLU) as it was the worst relative performer for the shortened week. The Energy Sector ($XLE) saw the best performance, followed by Technology ($XLK).

Year-to-Date Sector Performance
Well we finally have a change in sector leadership as Energy overtakes Utilities has the best performing sector of 2014. Health Care ($XLV) is also close in jumping past Utilities. Consumer Discretionary ($XLY) and Industrials ($XLI) remain the under-performers for the year with Consumer Staples ($XLP) and Financials ($XLF) not far behind.

Disclaimer: Do not construe anything written in this post or this blog in its entirety as a recommendation, research, or an offer to buy or sell any securities. Everything in this post is meant for educational and entertainment purposes only. I or my affiliates may hold positions in securities mentioned in the blog. Please see my Disclosure page for full disclaimer. Connect with Andrew on Google+, Twitter, and StockTwits.
Pingback: Weekly Technical Market Outlook: July 7 – Andrew Thrasher | Marty Investor