Technical Market Outlook 4/27/2015

Well stocks appear to be ready to see some fresh air as many major indices are testing prior highs or have already broken out. When this type of price movement happens the first thing I do is turn to the market internals and measures of risk taking to see if there are signs of confirmation. I’ll dive into some of these today in this Technical Market Outlook.

Trend
What better place to start than the trend of the S&P 500 ($SPX). For the bulk of 2015 we have seen this major U.S. index rise and then quickly fall back to its 100-day Moving Average before making another attempt to advance. Each move created a slightly higher high and higher low, which is positive for trend followers, albeit the progress has been slow and choppy.

trend

Small(er) Caps vs. Large Caps
There are different ways to look at the ratio between small and large cap stocks. How you define ‘small’ is the key. In this chart I’m not looking at actual small caps but the smallest stocks in the S&P 500 ($SPX). The cap-weighted index is often controlled by what the largest of its holdings does. This can hide what the majority of the stocks are doing and in turn, not revealing any possible signs of weakness. By looking at the ratio between the Guggenheim S&P 500 Equal Weight ($RSP) and the cap-weighted SPDRs S&P 500 ($SPY) we can see which one is leading, the larger portion of the index or the smaller capitalization companies.

In this chart we can see that the ratio between RSP and SPY has created a false breakout of its prior high set in 2014. When the black line is rising the smaller cap stocks are leading the overall index, a possible notion that traders are taking on more risk as they show preference for smaller company’s stocks. As the S&P 500 is just a few points away from a new high, the smaller portions of the index are beginning to drag.

RSP vs SPYBreadth
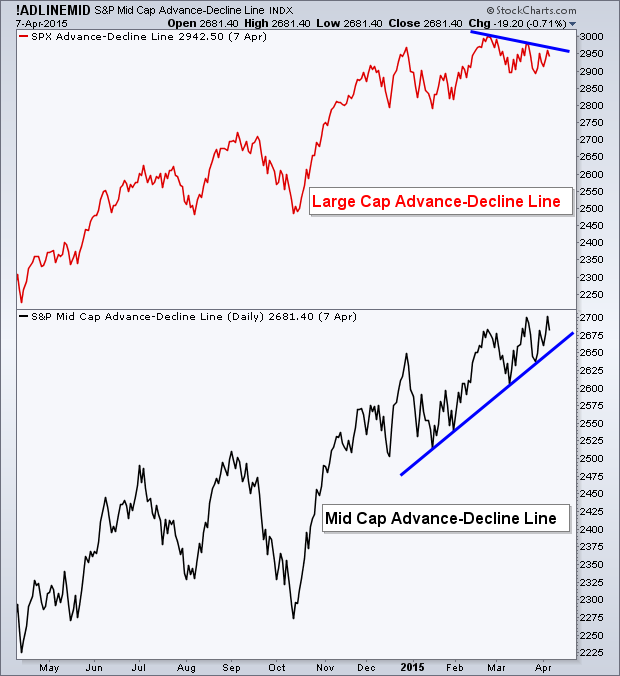
One of the more bullish charts for the advance in stocks right now is that of the Advance-Decline Line, a measure of breadth for the market. The Common Stock-Only NYSE Advance-Decline Line has continued to confirm the up trend in U.S. stocks. The A-D line for the S&P 500 also is very close to breaking out like its respective index. The Percentage of Stocks Above Their 200-day Moving Average has also made good progress as it digs itself out of the down trend that had been created. While not near its high, this breadth indicator has begun an up trend of higher lows and higher highs. From a breadth perspective, things appear positive for stocks.

breadthCommodities vs. Treasury’s
Back in December Jeffrey Gundlach did a webcast calling TIPS (Inflation-protected securities) for losers. A few days later Bill Gross did an interview with CNBC and said TIPS looked like an attractive opportunity. Once again, the Doubeline bond manager appears to be on the right side of this call as inflation has declined over the last several months. One way we can chart inflation is through the relationship between commodities and Treasury’s.

If commodity prices are rising at a faster pace than bonds, then it’s believed that inflation is also on the rise. As you can see from the ratio chart below, commodities have been under-performing the 10-year Treasury bond since early 2014, However, it seems we may be seeing a possible double bottom in this relationship, which would favor commodities over Treasury’s. At the same time momentum via the Relative Strength Index (RSI) is creating a positive divergence by putting in a higher low.

I’ll be watching to see if the ratio between $CRB and $UST is able to break above its prior high at 1.80. If this happens then we may begin seeing signs of inflation re-introducing itself. What would cause this? That’s not my concern nor on my radar. All I know is this setup may turn to be bullish for commodities after the terrible performance they have had over the last year.

comm vs treas

Momentum
While Breadth looks bullish for stocks, momentum has been unable to produce the type of movement we’d like to see. The daily Relative Strength Index (RSI) remains in a range between 60 and 40. The MACD indicator also has been making a series of lower highs. If the S&P does rise and high a new high this week, it will unlikely be accompanied by momentum which will cause many traders to pause.

momentum

Semiconductor’s
One of my most widely shared posts was on the significance of Semiconductor’s and how they have replaced Copper as an indicator of risk-taking for the market. I was fortunate enough to have it published in the Market Technician Association Newsletter as well as the Chart of the Day at Bloomberg.

As the global economy becomes more technologically focused the market has shifted from industrial materials to ones found in just about every electronic created – semiconductors. This is why I believe this index is important to watch for signs of confirmation in equities. Up until the last few months Semi’s had been marching instep with the S&P 500. But that has changed as they are well off their high as the S&P tests its own high – creating a bearish divergence. This has historically not been a great sign for stocks. Some of the previous downturns in U.S. markets have been led by this type of lack of confirmation in semiconductors. Are we approaching the same kind of weakness?

semi

Year-to-Date Sector Performance
2015 has continued to repeat ’13 & ’14 with strength coming out of the Health Care ($XLV) sector. Consumer Discretionary (Cyclicals) ($XLY) also have been performing well as they are the second best performing sector YTD. Utilities ($XLU)  and Financials ($XLF) are the two worst performers so far this year.

YTD sector
Disclaimer: Do not construe anything written in this post or this blog in its entirety as a recommendation, research, or an offer to buy or sell any securities. Everything in this post is meant for educational and entertainment purposes only. I or my affiliates may hold positions in securities mentioned in the blog. Please see my Disclosure page for full disclaimer. Connect with Andrew on Google+, Twitter, and StockTwits.

Is This Cycle Foreshadowing A Turning Point In The Market?

Below is a chart of the S&P 500 ($SPX) going back to 1999. The red marker on the bottom shows a defined cycle with the same period between each peak and valley. I’ve marked blue dotted lines to show the bottom of the cycles. You’ll notice that the bottoms of many of these defined period cycles have marked important turning points in the market. Now, not every trough was deemed to highlight a peak or bottom in the S&P 500 but I find it interesting that many of them do. The last three cycle bottoms coincided with the 2011 high, near the 2012 low, and a short-term low after a few percentage points of selling in 2014. The lows also seemed to have marked the 2000 and 2007 peak in the equity index.

Keep Reading: Is This Cycle Foreshadowing A Turning Point In The Market? (See It Market)

Disclaimer: Do not construe anything written in this post or this blog in its entirety as a recommendation, research, or an offer to buy or sell any securities. Everything in this post is meant for educational and entertainment purposes only. I or my affiliates may hold positions in securities mentioned in the blog. Please see my Disclosure page for full disclaimer. Connect with Andrew on Google+, Twitter, and StockTwits.

Traders Chase Easy Monetary Policy Across the Globe

While U.S. markets enjoyed its own period of drug-induced Federal Reserve policy, foreign markets are now having their own party. With the drug being Quantitative Easing (QE), traders are constantly on the lookout for where they can get their next fix. The chart below, from Bianco Research, does a good job at showing it’s the markets with easy monetary policy that are catching bids.

foreign markets

Source: QE Works, April Edition (Bianco Research) 
Disclaimer: Do not construe anything written in this post or this blog in its entirety as a recommendation, research, or an offer to buy or sell any securities. Everything in this post is meant for educational and entertainment purposes only. I or my affiliates may hold positions in securities mentioned in the blog. Please see my Disclosure page for full disclaimer. Connect with Andrew on Google+, Twitter, and StockTwits.

Can The Russell 2000 Continue to Lead the S&P 500?

Since mid-January Large Cap stocks (i.e. the S&P 500) have been nipping at the heels of Small Cap Stocks (i.e. Russell 2000). In 2014 many traders and market commentators pointed to the major under-performance as a big concern for the market as a whole. But it seems that notion as been left in the rear view mirror as stocks have continued to march higher and small caps ($IWM) have improved. The conversation has now shifted from “look how bad they are doing!” to “look how much stronger they are!” Oh how things change.

I often focus on price charts below is a chart of the Advance-Decline Line for the S&P 500 (top panel in black) and the S&P Small Cap Index (bottom panel in Green). While breadth for the S&P 500 has been rising right along with price, lately it has begun to put in a set of lower highs. While this is occurring the Small Cap A-D Line has been setting new highs, keeping its up trend alive. I’m not using this chart to make a market call, but to simply point out an interesting development taking place.

A-D Line small and large
So is this occurring because it’s historically a strong time period for small cap stocks? Actually no. April is one of the worst months for out-performance by $IWM over $SPY. Since 2007, as this next chart show, $IWM has only outpaced it’s larger cap counterpart 22% of the time (2009 and 2010).

IWM SPY

If the Russell 2000 can keep its party alive and continue to lead the S&P 500 during one of its historically weakest periods of time then that would be a pretty big achievement in my eyes and one that would be tough to ignore. So far $IWM has begun to lag $SPY during the first week of trading in April, starting the Russell 2000 in a hole for it to dig out of. Will it be able to do it? We’ll see.
Disclaimer: Do not construe anything written in this post or this blog in its entirety as a recommendation, research, or an offer to buy or sell any securities. Everything in this post is meant for educational and entertainment purposes only. I or my affiliates may hold positions in securities mentioned in the blog. Please see my Disclosure page for full disclaimer. Connect with Andrew on Google+, Twitter, and StockTwits.

A Shift Favoring Canadian Equities

Since last August traders have been showing a strong preference for U.S. equities over Canadian stocks. But this trend appears to be ending as the relative performance of the two markets has begun showing signs of a shift favoring Canada.

In September ’14 I wrote a post for See It Market titled Trouble Ahead For Canadian Stocks? as I outlined the bearish chart I was seeing for $EWC, the Canadian ETF. A double top had formed and was accompanied by a bearish divergence in momentum. Price ultimately broke support of the prior high and fell roughly 18% over the next five months before finding a low in January of this year.

While it seems the theme has been U.S.-focused over the last several months, that may be changing. J.C. Paret’s wrote a good post on this topic with his expectations for the second quarter of 2015. It seems Canada may also be showing some signs of positive relative strength. I first mentioned this ratio and the bullish divergence in momentum on Twitter in early February. However, price continued to favor the S&P 500 as Canada continued to lag our markets for another two months.

Below is daily chart of the relative performance of $EWC and $SPY. When $EWC is outperforming $SPY the line rises, when the opposite is true the line goes down. This can occur by $EWC rising more or even just falling less than the S&P 500 ($SPY). As you can see, the relative performance has been in a down trend since August while the Relative Strength Index (RSI) momentum indicator has been in a bearish range for the same period of time.

But as of late the tides have begun to turn. The ratio between these two markets has begun to rise and the declining trend has been broken. We can also see that momentum has broken above its resistance that helped define its range. This is a positive sign for $EWC that momentum may begin supporting the thesis of Canadian stocks taking the reins.

EWC SPY

Disclaimer: Do not construe anything written in this post or this blog in its entirety as a recommendation, research, or an offer to buy or sell any securities. Everything in this post is meant for educational and entertainment purposes only. I or my affiliates may hold positions in securities mentioned in the blog. Please see my Disclosure page for full disclaimer. Connect with Andrew on Google+, Twitter, and StockTwits.