
Y2K was a hot topic in 1999. It was believed that when the clock struck midnight to bring in the new year, all kinds of chaos would be unleashed. This was thought to be caused by computers not recognizing the year “2000” since early programmers used “19” as the two-digit code for year’s and the shorthand was thought to cause computers to think it was the year 1900 instead of 2000.
The fear of Y2K led to billions spent on prevention. Banks stockpiled cash, nuclear reactors increased security and households built up stockpiles of food (I wonder if toilet paper was a hot commodity like it was in March during the coronavirus lockdown). Y2K prep is estimated to have cost $600 billion worldwide and the NYSE also reportedly spent $29 million to prep for potential problems.
This wasn’t the first and it surely won’t be the last apocalyptic threat Americans and more broadly, Humans, will face. I suppose we’re a species that’s been taught by history to panic. Daniel Kahneman won the Nobel Prize for his research on the psychology of human behavior around uncertainty and decision-making after all.
Most recently the topic du jour has been the U.S. presidential election. While I’m sure some subset of the population is treating the outcome ala Y2K, storm shelters full of canned goods and all. The subject is more fraught with uncertainty in its path to resolution. Will the election turn out to be just Y2K 2.0? Are the concerns all being overblown? Just like at midnight on December 31st, 1999 – we won’t know until the time is upon us.
But this hasn’t prevented financial prep to take place and that’s where my focus is today.
Recently there’s been several stories of brokerage firms raising minimum margin requirements on their client accounts. The likely reason is expected increase in volatility. Interactive Brokers, starting October 5th, raised their requirements as much as 35%.
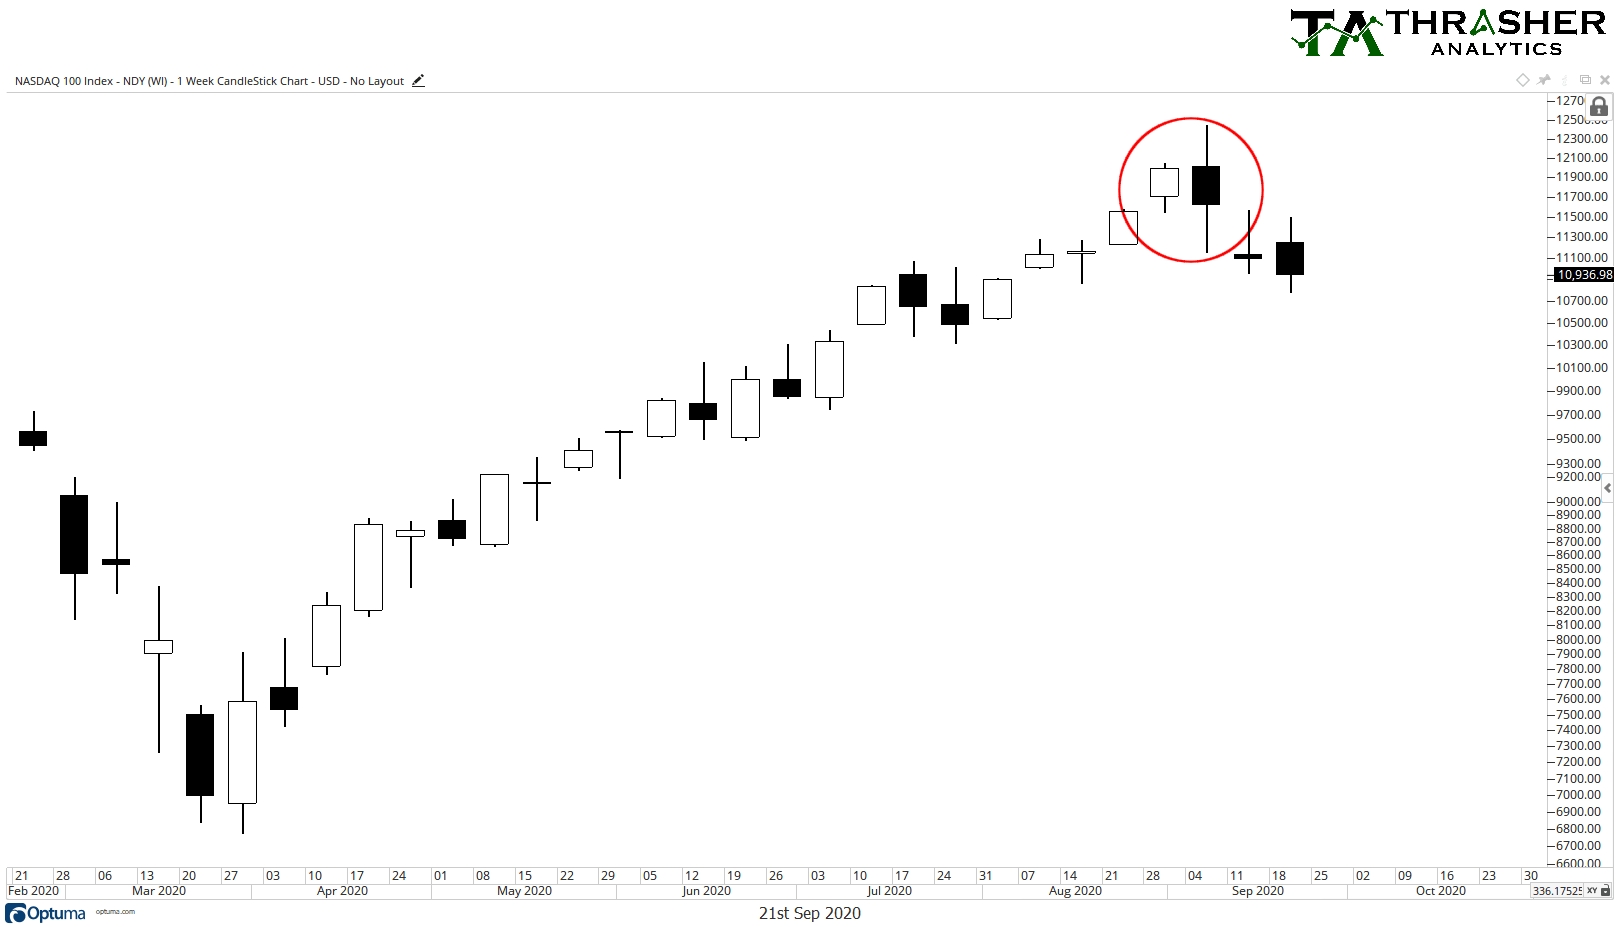
Remember the circuit breakers that kept getting tripped back March? We would see these massive swings in the futures market ahead of the open because prices would drop 5% and the CME would halt trading for a period of time. That 5% limit was just raised to 7% as noted by Matt Thompson several days ago. The CME apparently is also concerned with heightened volatility as election season approaches. They aren’t alone, Large Speculators have taken on a massive net-short position in Nasdaq futures, again most likely assuming fireworks come November 3rd.
The Volatility Index is also joining the festivities as a prep tool by Y2K 2.0. Bloomberg strategist Cameron Crise shared, “In the history of the VIX futures contracts, we’ve never had an event risk command this sort of premium into forward-dated vol at a specific tenor.” The October VIX futures contract has held a massive premium all year. Remember VIX futures are based on forward expected volatility, so October contracts would encompass the election period more so than a November contract. Rocky Fishman of Goldman Sachs recently wrote that traders believe the election will be contested and drawn out through year-end, “Option markets have gradually been shifting risk premium from 4-Nov to later in November and beyond. The market now shows an extended period of high volatility well beyond Election Day. […] This likely reflects the potential for election results to be finalized with a delay, the potential for an extended equity market reaction to what is currently a competitive race, and the potential for vaccine news around the same time.”
Has there been enough reason to cause such consternation? Well it’s gotten to the point that the chairman of the Joint Chiefs of Staff has had to comment on it. Gen. Milley wrote, “In the event of a dispute over some aspect of the elections, by law, U.S. courts and the U.S. Congress are required to resolve any disputes, not the U.S. military. I foresee no role for the U.S. armed forces in this process.” The fact that military leaders need to weigh in on such a topic is astonishing. No wonder financial markets are preparing for the worst.
The question then begins, will their worry and bid for volatility be rewarded? There’s no answer to that just yet. But history has shown many times over that over-reaction and under-reaction are rarely rewarded and very few times does the market correctly price an event. Meaning, all the conjecture over the election and expectation that volatility remains high through year-end may show us the 2020 version of Y2K: Election Edition. But maybe not. Maybe we do see electoral fireworks, and not of the Disney World variety, but of the Washington D.C. chaos assortment. It would be very “2020” to have a multi-month contested election, each day shoot up new allegations, lawsuits, and speculation for traders to parry.
Come the strike of midnight to bring in 2021 I hope we know how this story ends. I hope we aren’t still discussing who our next President will be. There will surely be opportunity created for the events to come, for both bears and bulls. We’ll see just how much ink is spilled in both the press offices and law offices before it’s all said and done.
Disclaimer: Do not construe anything written in this post or this blog in its entirety as a recommendation, research, or an offer to buy or sell any securities. Everything in this post is meant for educational and entertainment purposes only. I or my affiliates may hold positions in securities mentioned in the blog. Please see my Disclosure page for full disclaimer. Connect with Andrew on Google+, Twitter, and StockTwits.


